Make analytics accessible to CEOs, functional teams, and all other users that need to stay on top of the business by creating interesting, interactive dashboards that leverage real-time data to tell a story
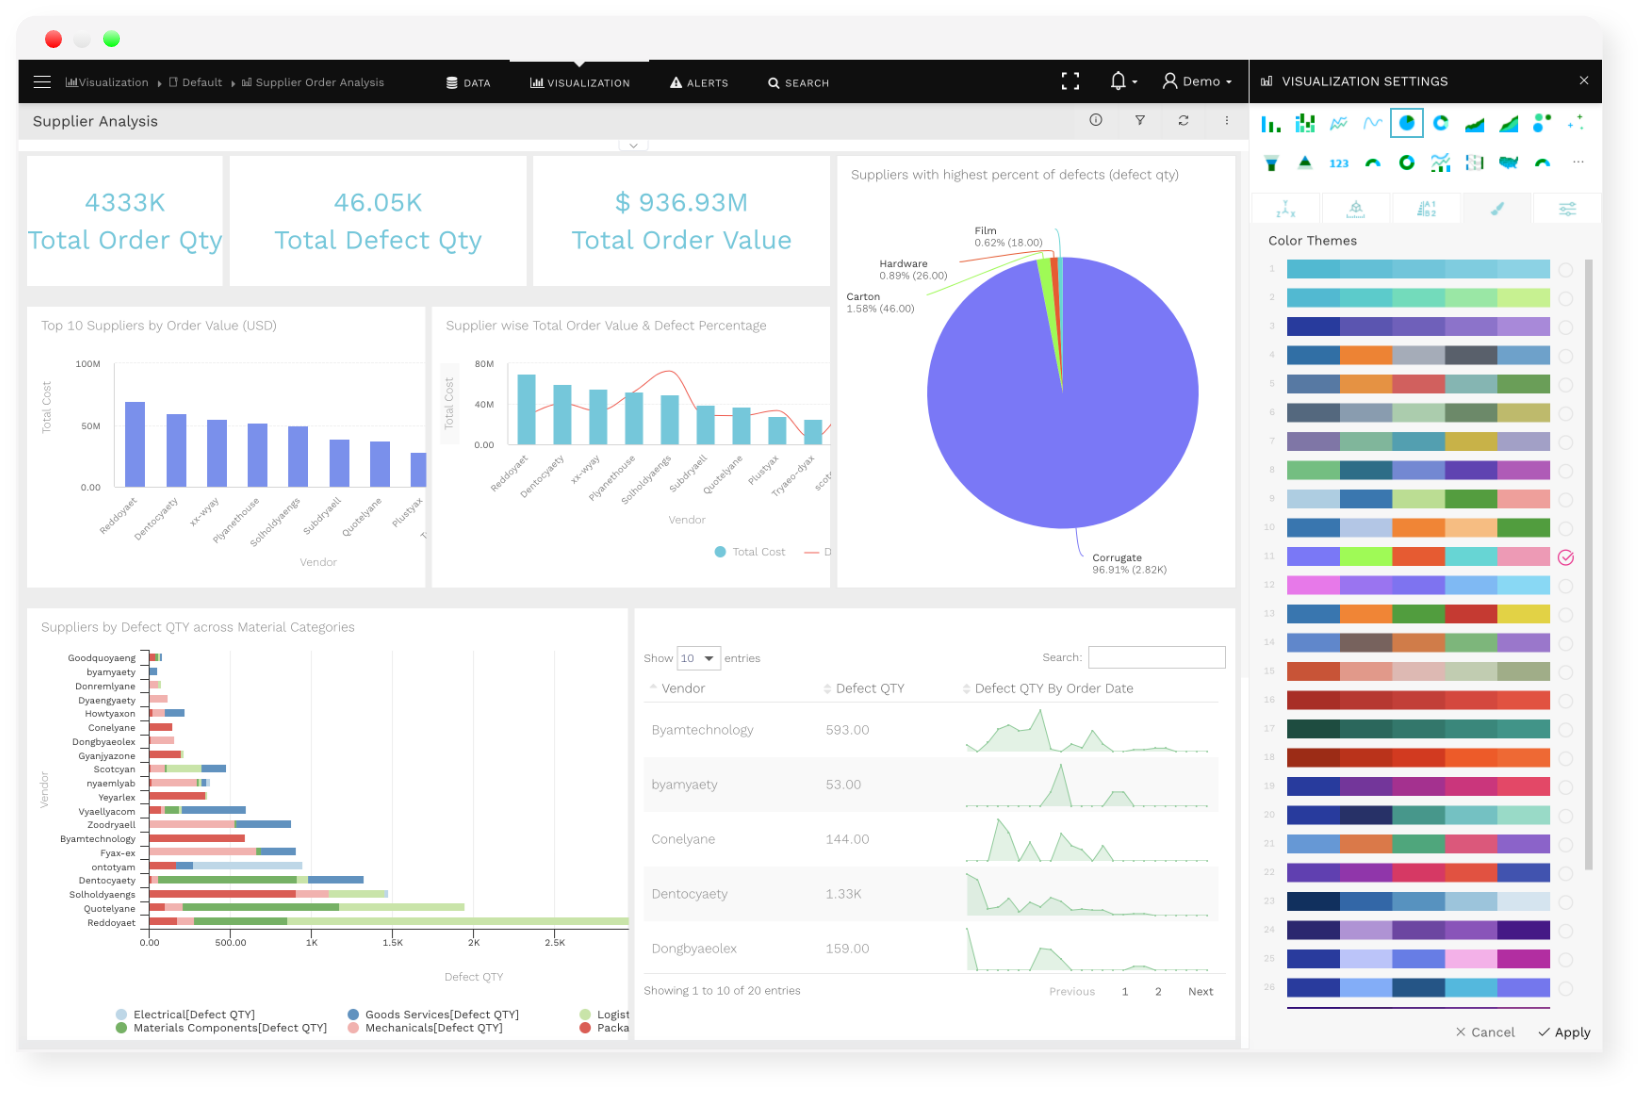
Stunning Visualizations
With BIRD, the optimal visualization is just a click away. Get the information you need to make better decisions right away
You can completely understand the facts of your business with the more than 80 different chart types at your disposal, ranging from straightforward bars and lines to trellis charts and word clouds
Take advantage of a variety of charts, widgets, pivot tables, and tabular views to create informative reports and dashboards
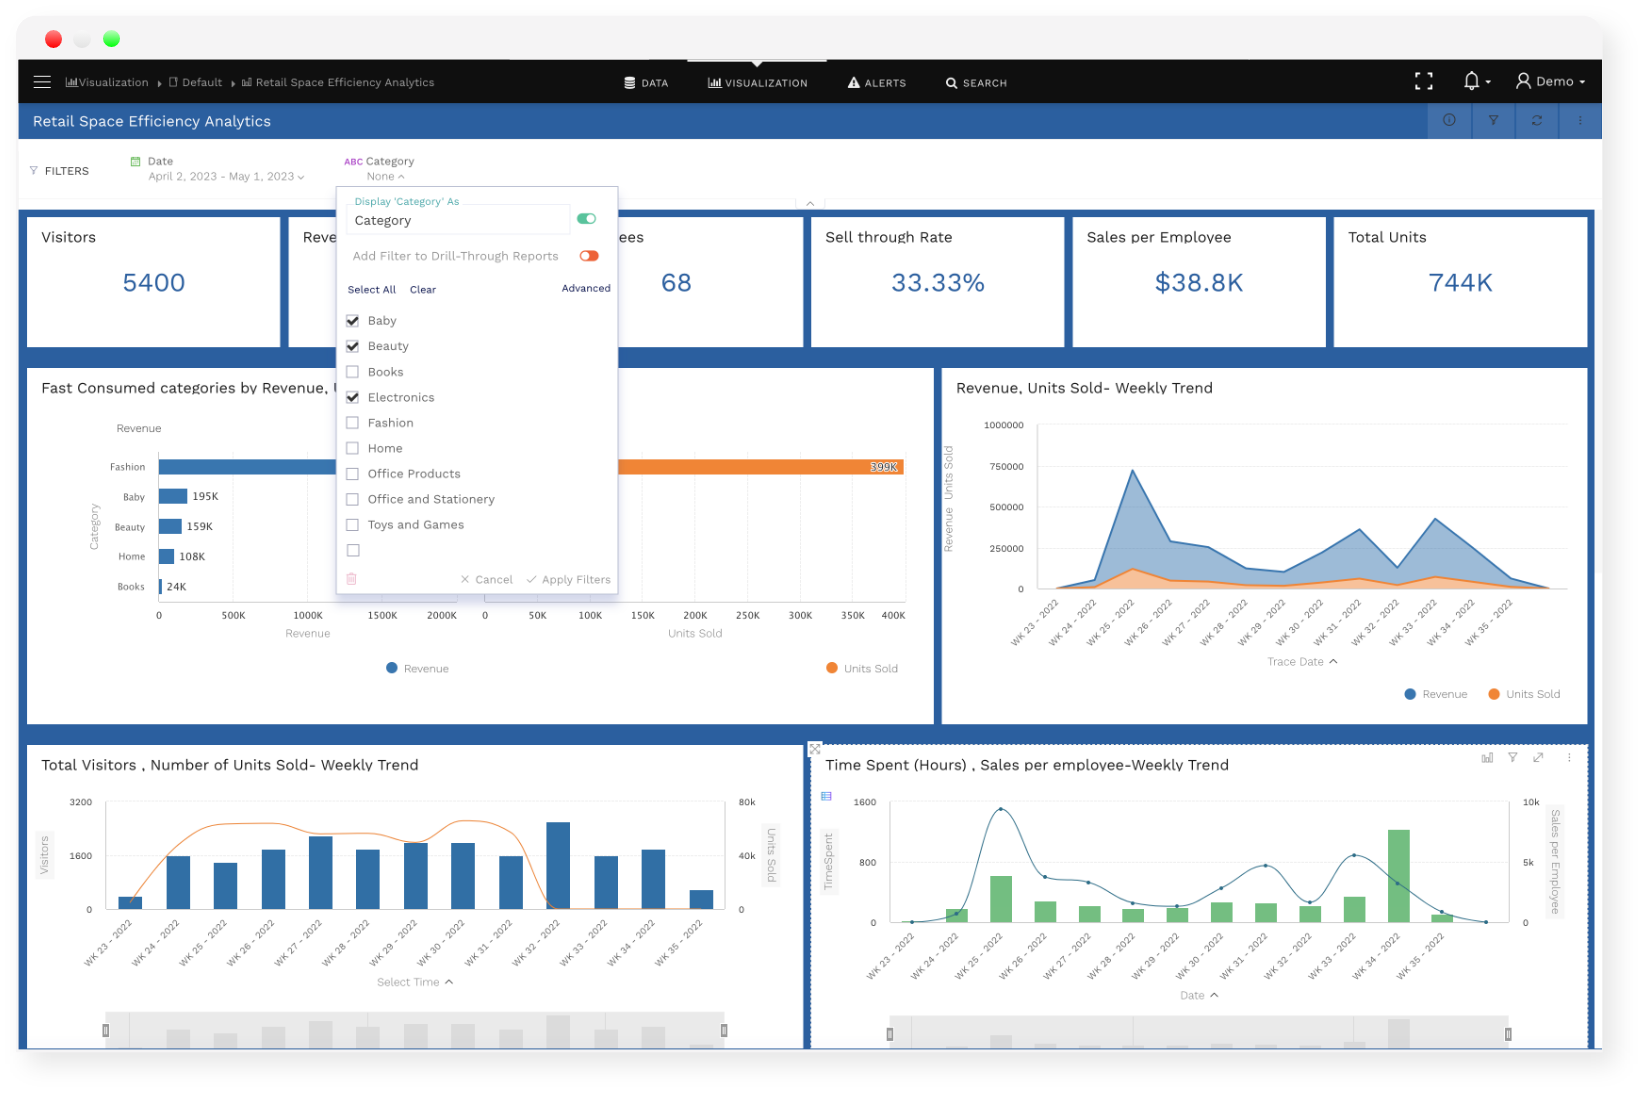
Interactive dashboards
Drill downs and global filters can be used to quickly focus on the information needed to take action
Every action instantly updates every interactive graph, table, and item to reflect the current situation
Schedule and Collaborate
Schedule your preferred dashboards or reports and get them delivered to your inbox with the latest data available at your desired time and frequency
Share the dashboards and reports you produce with your coworkers so that you can work together
Having complete control over who has access to and how information about your clients or employees is used is important